The mystery of the memory leak...
Some time ago, I was developing some data processing script in Python. I was sure I did everything well - my script worked as intended, all unit tests passed and I even tested the script on small data, and it worked properly. But I encountered an interesting problem, the execution failed…
Everything seemed to be fine until… I ran it to process a HUGE (1 400 000 files, 50GB) volume of data. The script was massively processing big data but suddenly a container, in which the script was run, was killed due to Out Of Memory error. The script was wrapped into a Docker container and deployed on the Kubernetes with defined maximum usage of RAM limit. So, what actually happened?
In such cases, it’s always a good idea to check for CPU and memory usage over time graphs.
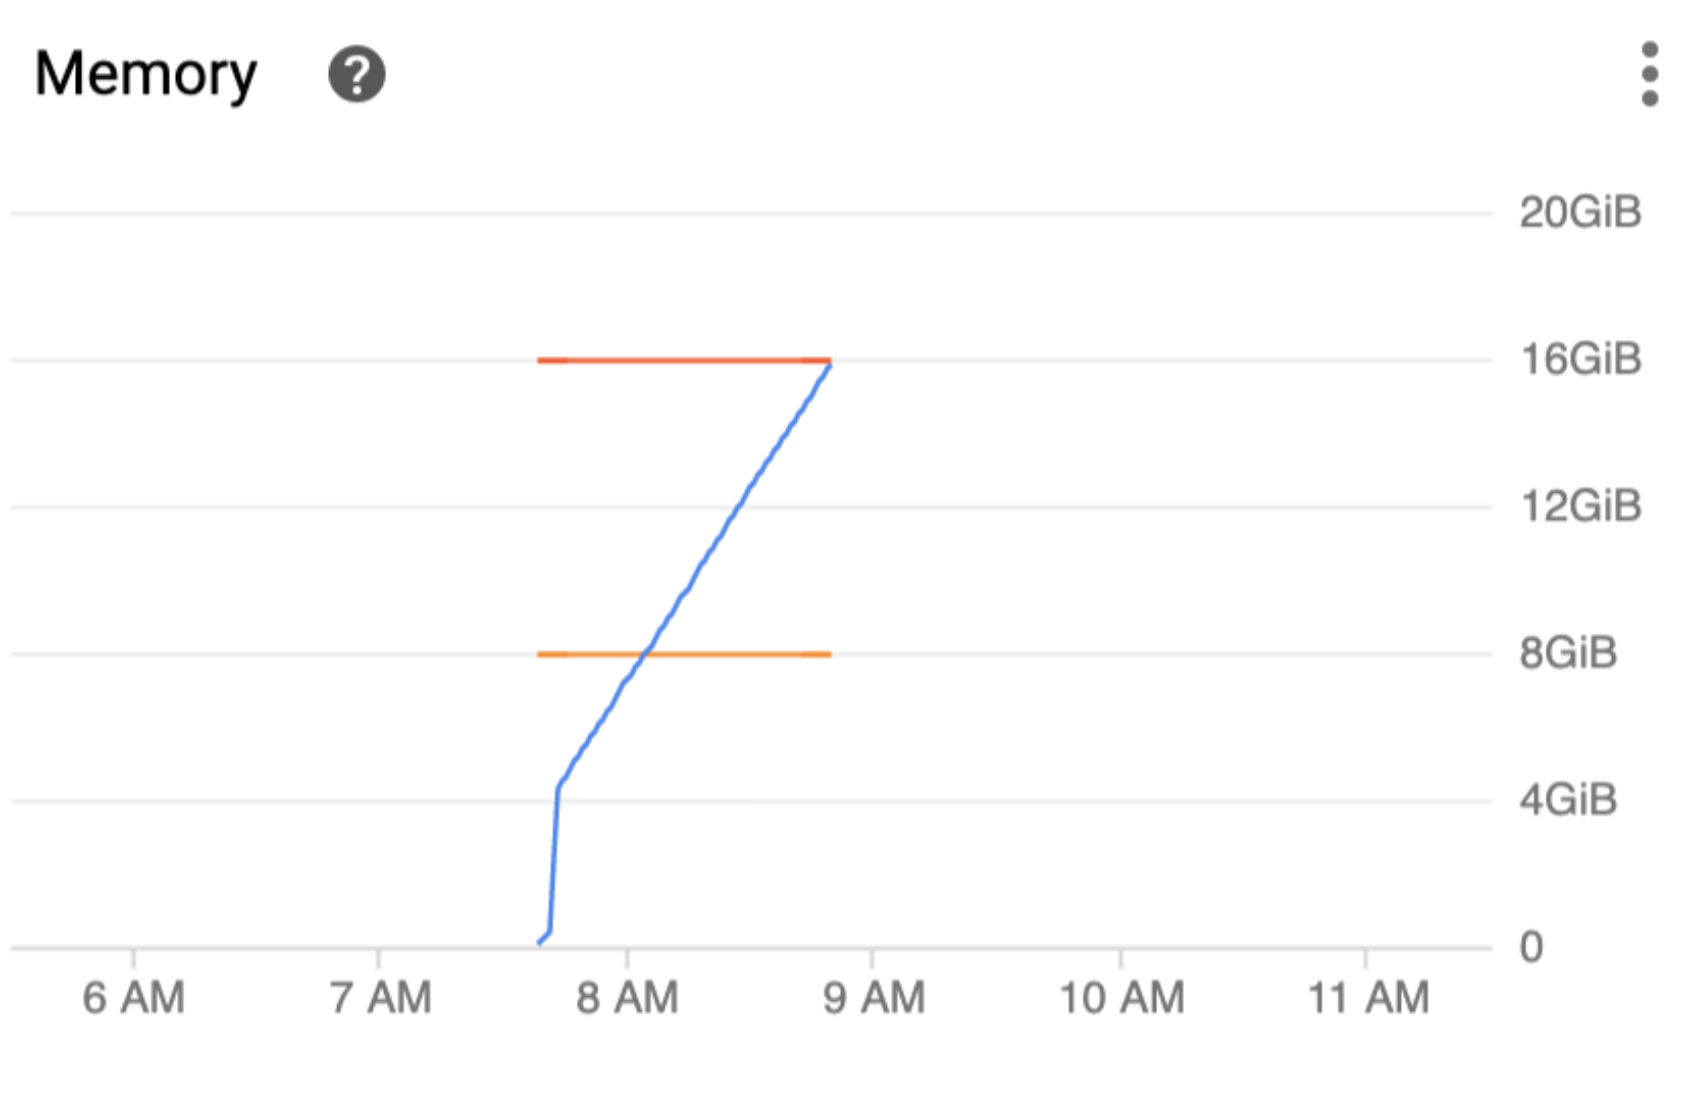
I checked the graph of memory usage over time, and it looked like that.

I saw that memory usage constantly grows. It means that my script allocates more and more memory for objects, much faster than it frees some memory. This problem is called a MEMORY LEAK. But, what is the cause of that?…
I had to process a big volume of data, so to speed up processing I used multithreading in Python. The threads were my first suspect, so I started to analyze how I use them.
I needed to provide GCS (Google Cloud Storage) client object for each thread to be able to perform my data processing. Google Cloud Storage client isn’t thread-safe so each thread requires its own copy of that. During the script execution, a bunch of threads is working in a pool, performing input-output heavy operations in a loop. Probably the problem lies in a way of storing data in the threads. Let’s verify that!
I performed a code-review together with my friend and he helped me to find that this actually is a problem. Each thread created a seemingly harmless GCS Client object every time the operation is performed. We’ve found out that it’s not actually harmless - it was the root cause of the memory leak!
The solution was to use threading.local() in Python (docs.python.org/…#threading.local) - which allows storing data for each thread. After applying this fix - GCS client object was created only once for each thread. The memory leak problem is solved now! :)
Code with the Memory Leak issue
from google.cloud import storage

...

class SomeClass:
    def __init__(project_id):
        self.project_id = project_id

    @property
    def client(self):
        return storage.Client(project=self.project_id)
Code after applying fix - using threading.local()
from google.cloud import storage

...

class SomeClass:
    def __init__(project_id):
        self.project_id = project_id
        self.thread_local = threading.local()

    @property
    def client(self):
        if "gcs_client" not in self.thread_local.__dict__:
            self.thread_local.gcs_client = storage.Client(
                project=self.project_id)
        return self.thread_local.gcs_client
After applying the fix, the script was able to process all this data in around 5 hours, thanks to multi-threaded operations which sped up the whole thing a lot.
Key takeaways:
- some problems will appear ONLY when Python script is run on a MASSIVE scale
- memory leak occurs when your application allocates more RAM than it frees in time
- you can spot a memory leak by inspecting memory usage over time graph
- memory leaks are pretty tough to debug - usually, the only message you get is this “Out Of Memory” error
- when encountered a memory leak - then your goal is to find this piece of code which “eats” memory :)
- Google Cloud Storage Client object isn’t thread-safe and leaves some leftovers in the memory
- threading in Python might be tricky - if you encounter some problems it’s often good to take a step back to get a better understanding of what’s going on under the hood
- threading.local() in Python allows storing some data per thread
